
Introduction
|
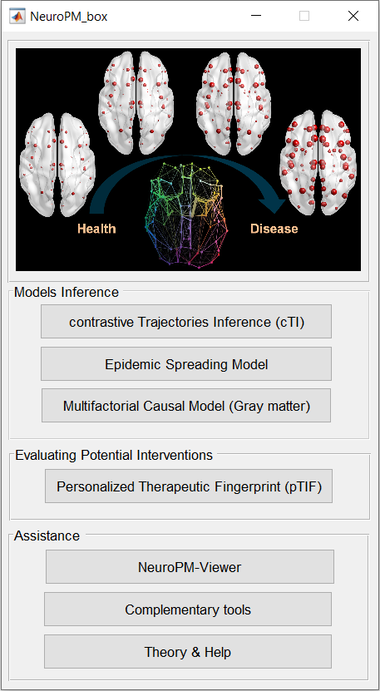
The Neuroinformatics for Personalized Medicine toolBox (NeuroPM-box) is a free cross-platform user-friendly multitool software for advanced integration of molecular, histopathological, multimodal neuroimaging, and therapeutic data. The toolbox currently comprises four methodological implementations:
We aim to synergize the different methods and data modalities, to facilitate the discovery of novel and more efficient methods for multiscale and multifactorial data analysis, and the subsequent patients stratification. Standalone software applications for Windows, Linux and Mac are provided. It includes a user-friendly interface (GUI) and visualization which does not require programming expertise. We have provided an easy-to-follow tutorial to help you get started. Regular NeuroPM-box training courses will be performed each year to train users on the different methods/modules. First course is planned for November 2020 (please keep checking here for details). NeuroPM-box is shared freely with academics and non-for-profit researchers, for non-commercial use only. For commercial use, we can undertake the analysis for you (funding obtained from for-profit users will be in turn used for software extension/maintenance and to support our lab’s research). Please see License. Download the Software & Tutorial! Your help to improve NeuroPM-box is highly appreciated. For any enquiries, comments/suggestions, please contact: yasser.iturriamedina@mcgill.ca. |
|
Software Citation (see also Tutorial for corresponding methods-specific citations):
Yasser Iturria-Medina, Felix M. Carbonell, Atousa Assadi, Quadri Adewale, Ahmed F. Khan, Robert Baumeister, Lazaro Sanchez-Rodriguez. Integrating molecular, histopathological, neuroimaging and clinical neuroscience data with NeuroPM-box. Nature's Communications Biology, 4, 614 (2021). https://doi.org/10.1038/s42003-021-02133-x
Yasser Iturria-Medina, Felix M. Carbonell, Atousa Assadi, Quadri Adewale, Ahmed F. Khan, Robert Baumeister, Lazaro Sanchez-Rodriguez. Integrating molecular, histopathological, neuroimaging and clinical neuroscience data with NeuroPM-box. Nature's Communications Biology, 4, 614 (2021). https://doi.org/10.1038/s42003-021-02133-x
Methods/Modules
Contrastive Trajectory Inference (cTI)
|
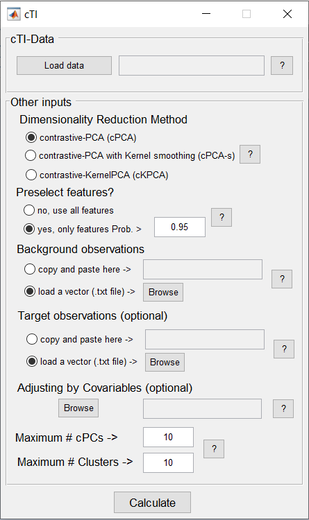
cTI applies recent advancements in artificial intelligence (AI), for exploring and visualizing high dimensional data to uncover underlying distinctive/contrasted paths in large-scale biological observations (e.g. genetics and neuroimaging data covering a biological process of interest, such as neurodevelopment or neurodegeneration). For instance, in the context of neurodegeneration, cTI enables the identification of the series of sequential molecular states (e.g. genetic alterations) across decades of disease progression, and locates the relative position of each individual subject along the identified path.
The algorithm provides a pseudo-time value per subject, reflecting the relative position of each subject on the identified long-term “timeline” (e.g. in neurodegeneration, the pseudo-time have been used as a personalized disease index, significantly predicting individual neuropathology, cognitive deterioration and future clinical conversion). Importantly, based on an analysis of the resulting weights/loadings for each feature included in the original data (i.e. ~40,000 genes transcripts), the cTI also estimates the specific contribution of each of the featured inputs (e.g. gene, biomarker) on the identified “timeline”, and the obtained pseudo-time value. It also assigns/stratifies the subjects to different sub-trajectories in the contrasted space. These sub-trajectories could reflect different tendencies in the data, such as, different disease variants |
|
Reference: Yasser Iturria-Medina, Ahmed F. Khan, Quadri Adewale, Amir Shirazi, ADNI, 2020. Blood and Brain Gene Expression Trajectories Underlying Neuropathology and Cognitive Impairment in Neurodegeneration. Brain, 143(2):661-673. DOI: 10.1093/brain/awz400. PMID: 31989163
Epidemic Spreading Model (ESM)
|
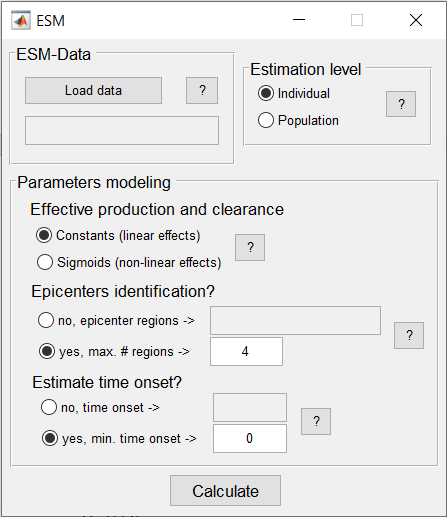
ESM, in the neurological context, characterizes the intra-brain propagation of infection-like “agents” through physical brain networks (e.g. anatomical, vascular, functional. The model estimates individual rates of “agent” clearance and production, which can follow linear or sigmoid relationships with the local concentration of the modeled infection-like “agents”. ESM has been successfully used to further understand amyloid and tau misfolded proteins spreading in the human neurodegenerative brain.
This ESM version includes multiple improvements compared to the initial ESM model, which were described in Iturria-Medina et al., 2014, Plos Comp Biol. The three primary enhancements include: i) a new focus on individual longitudinal data that allows the ESM to accommodate all available time points, increasing the robustness of the ESM parameters and the biological interpretably, ii) the ability to work with both the original imaging signals (e.g. SUVr values from PET) or with probabilistic-inferred values from the original images (the original ESM was defined only for probabilistic values), and iii) the ability to cover all possible numeric values for parameter optimization; consequently, the differential equations are now solved in a considerably more robust way, improving the finding of global minima solutions (instead of potential local minimums), thereby, increasing the robustness and interpretability of the parameters. |
|
Reference: Yasser Iturria-Medina, Roberto C. Sotero, Paule-J Toussain, Alan C. Evans, and the Alzheimer's Disease Neuroimaging Initiative, 2014. Epidemic Spreading Model to Characterize Misfolded Proteins Propagation in Aging and Associated Neurodegenerative Disorders. PLOS Computational Biology, Vol. 10 (11), e1003956.
Reference: Yasser Iturria-Medina, Roberto C. Sotero, Paule-J Toussain, Alan C. Evans, and the Alzheimer's Disease Neuroimaging Initiative, 2014. Epidemic Spreading Model to Characterize Misfolded Proteins Propagation in Aging and Associated Neurodegenerative Disorders. PLOS Computational Biology, Vol. 10 (11), e1003956.
Multifactorial Causal Model (MCM)
|
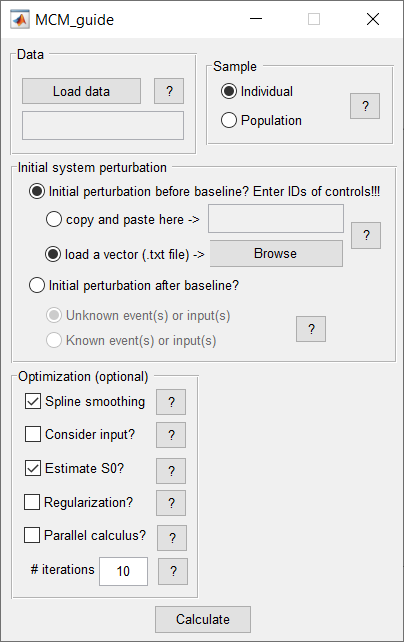
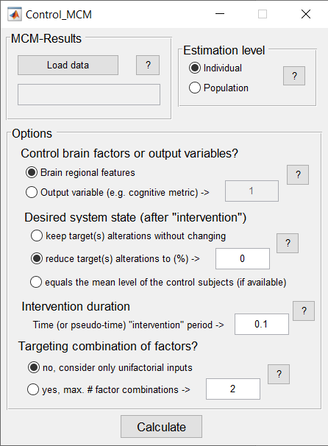
The Multifactorial Causal Model (MCM) of brain (dis)organization and cognition accounts for regional, multifactorial causal interactions (e.g. how toxic misfolded proteins alter cerebral blood flow [CBF], how subsequent alterations in CBF influences neuronal activity and gray matter atrophy, and vice versa), concurrent perturbation propagations through physical networks (e.g. intra-brain propagation of misfolded proteins, vascular or neuronal alterations across axonal and vascular connectomes), and the subsequent impact on cognitive/clinical integrity. The MCM considers that once a factor-specific event occurs in a given brain region or set of regions, it can directly interact with other biological factors and alter their states. The alterations can also spread through physical connections (e.g. anatomical, vascular connections) to other brain areas, where similar factor-factor and propagation mechanisms may occur, in a continuous cycle. The MCM has been successfully applied to the study of Alzheimer’s disease, clarifying multifactorial disease-specific mechanisms, and is currently being applied to other neurodegenerative disorders (e.g. Amyotrophic lateral sclerosis, Frontotemporal dementia, Parkinson’s disease).
The current implementation presents multiple improvements with regard to the initial model, as described in Iturria-Medina et al., 2017, Neuroimage. The two main enhancements include the ability: i) to focus on individual longitudinal data (in addition to allowing group-level fitting, as per the initial article), which allows the MCM to accommodate all available time points, increasing the MCM parameters and biological interpretability, and ii) to cover all possible numeric values for parameter optimization; consequently, the differential equations are solved in a considerably more robust way, improving the finding of global minima solutions (instead of potential local minimums), thereby, increasing parameters robustness and interpretability. |
|
Reference: Iturria-Medina Y et al, 2017. Multifactorial causal model of brain (dis)organization and therapeutic intervention: Application to Alzheimer's disease. Neuroimage. 2017 May 15;152:60-77
personalized Therapeutic Fingerprints (pTIF)
|
pTIF assumes that patients in an heterogeneous population require different treatments, not only depending on their brain's unifactorial alterations (e.g. tau/amyloid deposition or not, cerebrovascular alterations or not, atrophy or not) but also on their individual multifactorial brain dynamics (e.g. how different biological factors interact and respond [at the individual level] to potential clinical perturbations). Based on spatiotemporal analysis of multi-modal imaging data (i.e., PET, MRI, SPECT), pTIF values are a set of multivariate metrics that reflect the biological changes required to stop a given brain reorganization process or to revert the condition to normal state. In other words, the pTIF can integrate large amounts of data (e.g. thousands of multi-modal brain imaging measurements) to generate a simplified, individual patient profile of the quantitative-biological-factor modifications needed to control the reorganization process (e.g. disease evolution). Results in aging and late-AD (ADNI data) support the ability of pTIF to categorize the patients into distinct therapy-based subtypes, which correspond strongly with differential genetic and cognitive profiles.
|
|
Reference: Yasser Iturria-Medina, Felix M. Carbonell, Alan C Evans and ADNI, 2018. Multimodal Imaging-based Therapeutic Fingerprints for Optimizing Personalized Interventions: Application to Neurodegeneration. Neuroimage, Vol. 179, Pages 40–50. PMID: 29894824
Visualization
|
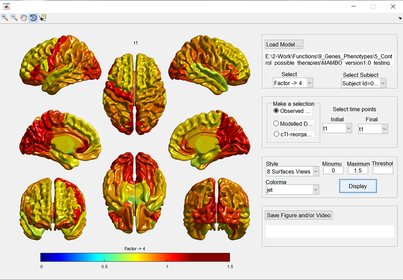
NeuroPM-box includes a versatile user-friendly interface (NeuroPM-viewer) that allows the visualization of all analyzed brain factors and their dynamic changes, in a single, 4 or 8 surfaces view. The user can show observed or simulated data at the individual- or group-level. This tool enables users to manage the time variable according to the specific visualization needs. Other picturing settings (colormaps, minimum and maximum values, threshold) can also be defined manually. The depicted figures can be saved in traditional images formats (.jpg, .png, and .tif) and dynamic brain videos (.avi).
|
|
